
Establishing a state minimum wage would improve the lives of many Louisianans, helping them make ends meet and care for their families. Louisiana is one of only five states without a state minimum wage law, meaning some workers in our state are still earning the $7.25 federal minimum wage that took effect in 2009 and many more workers earn just above that minimum threshold.
Since 2009, the cost of living has continued to rise, eroding the value of the minimum wage by over 30%. The chart below uses U.S. Bureau of Labor Statistics Consumer Price Index data to demonstrate what the minimum wage would be today if it had kept up with the costs families face:
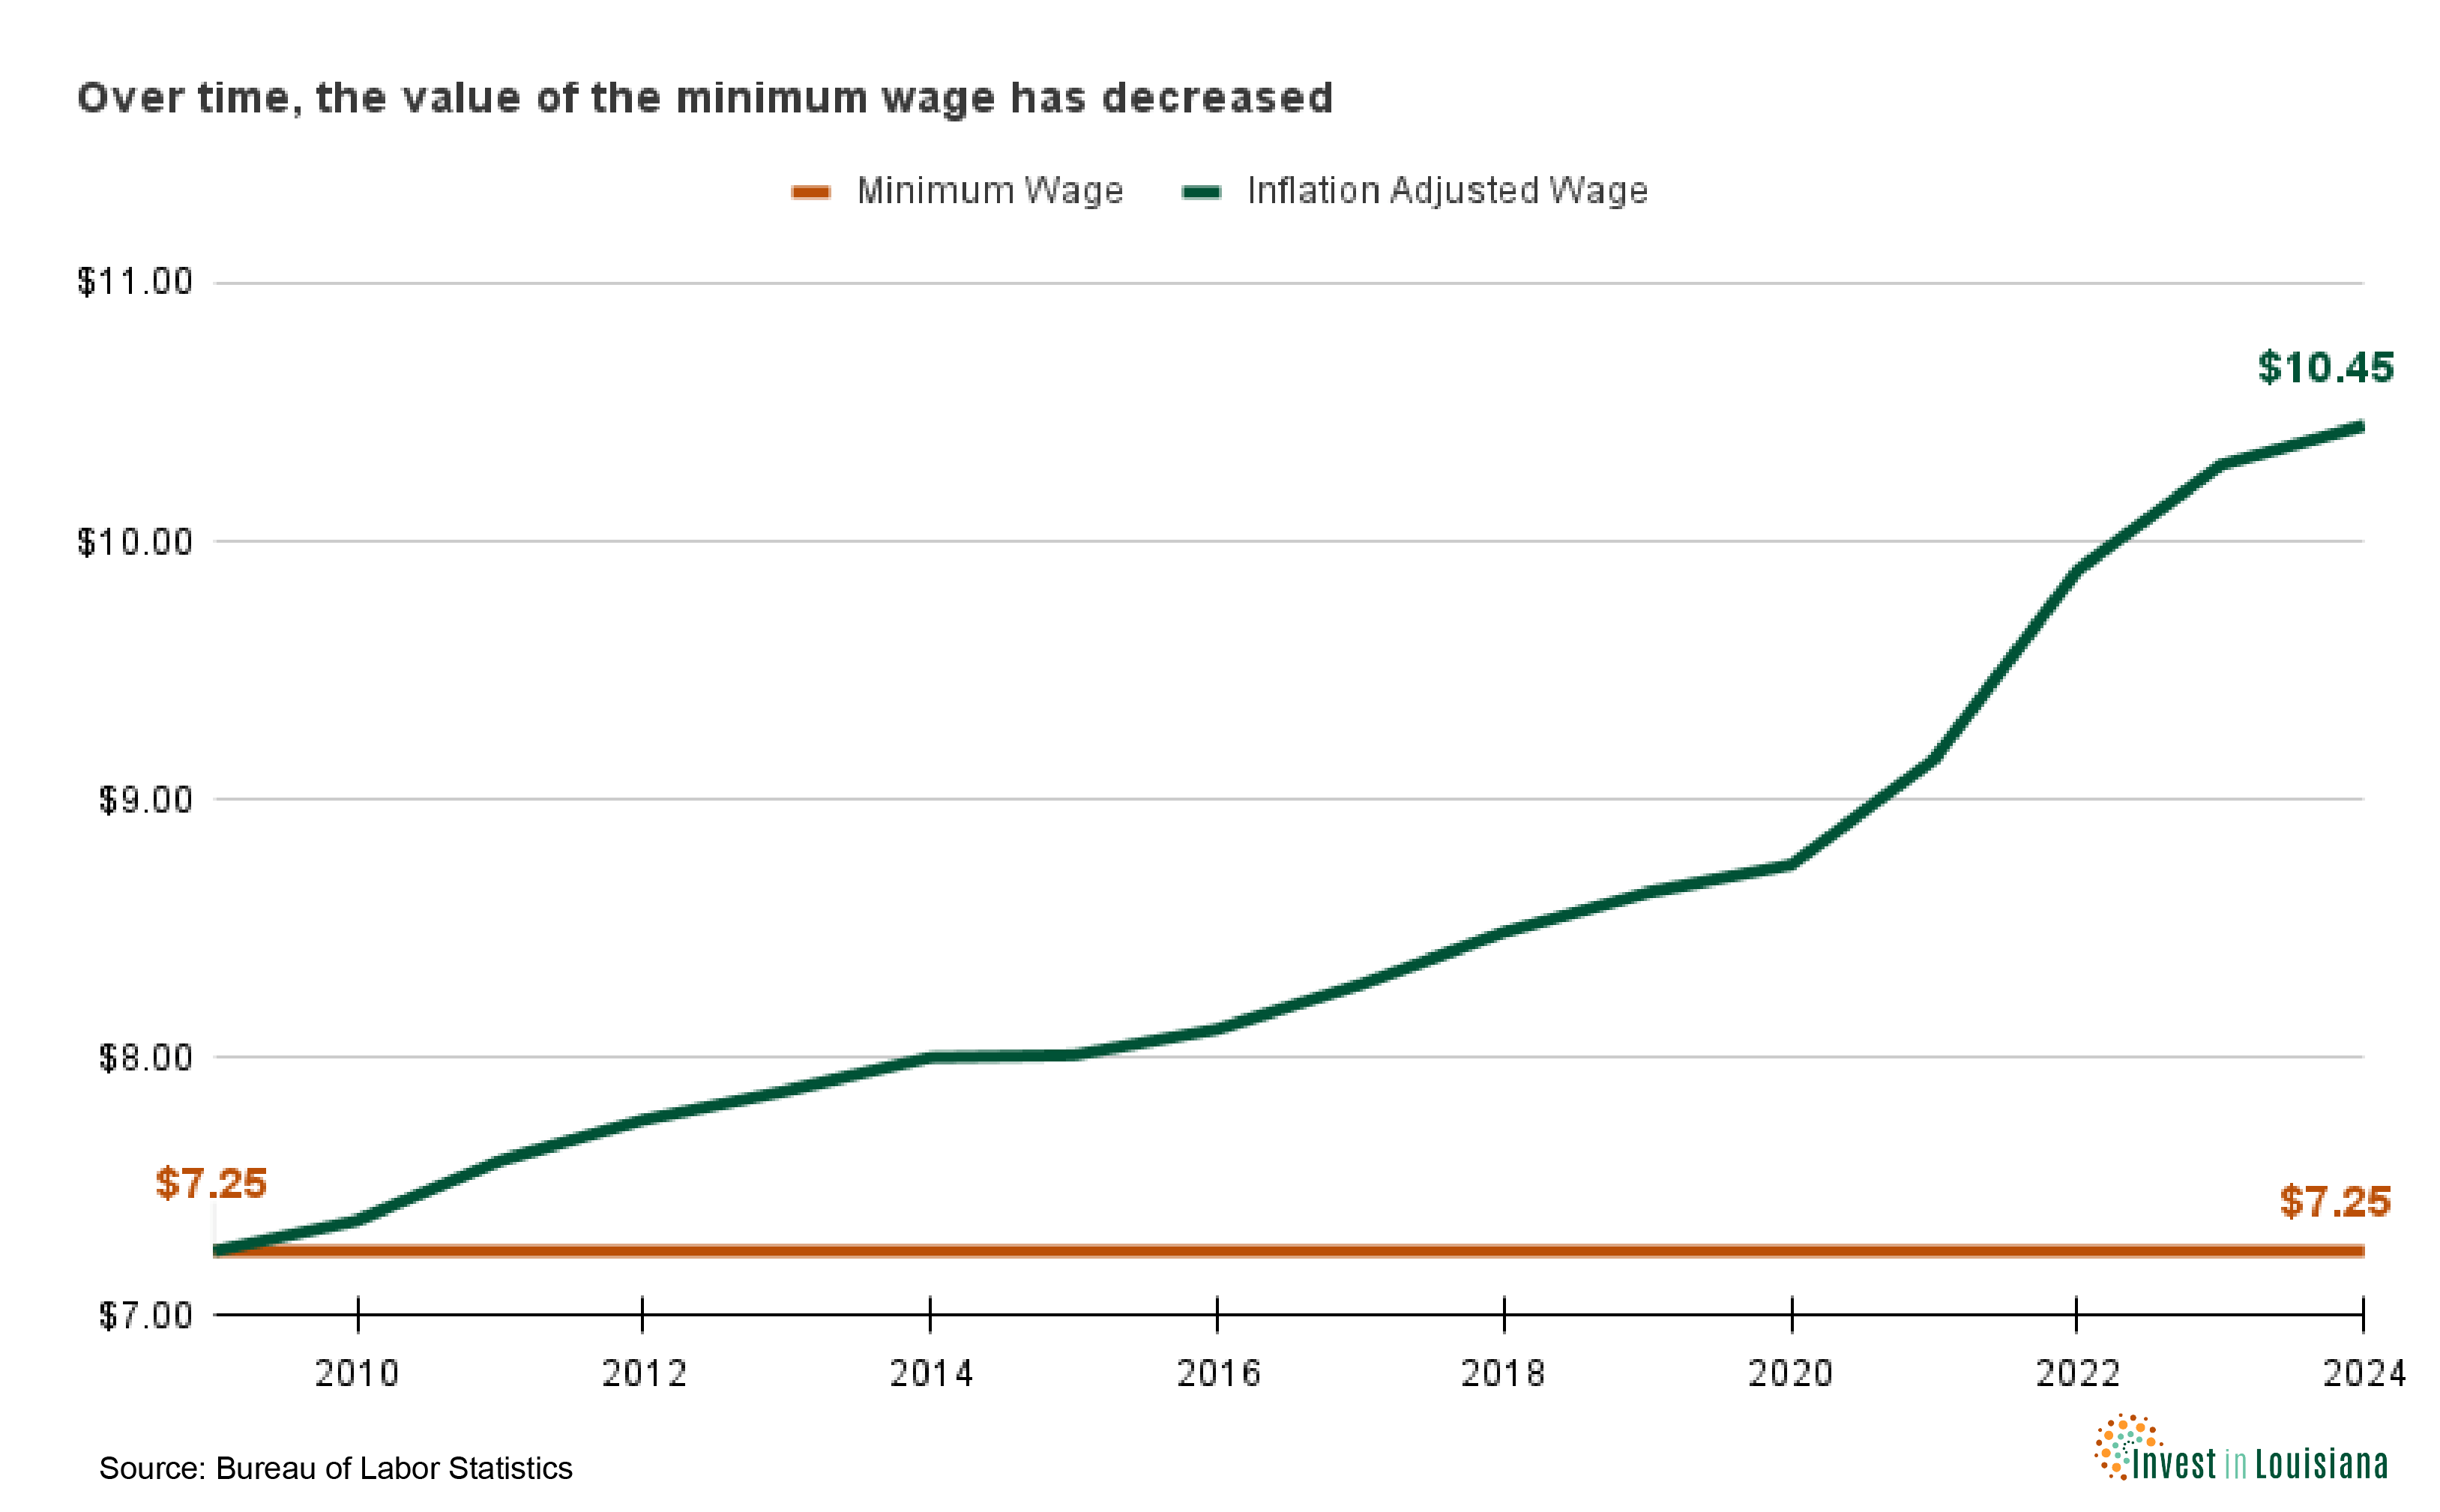
If the minimum wage had kept up with inflation over the last 14 years, it would be $10.45 an hour, over $3 an hour more than the $7.25 many Louisianans still earn today. The current minimum wage accounts for only 19.5% of the cost of living of a family of four with one working adult, falling far short of covering the basic needs of Louisiana workers and their families.
A raise in minimum wage is long overdue because wage stagnation leaves many families struggling to make ends meet. According to the 2023 ALICE in the Crosscurrents: Louisiana report from the Louisiana Association of United Ways, in 2021, half of Louisiana households could not afford basic expenses or save for an emergency, the second-highest rate nationally. These families often face food insecurity, difficulty keeping up with bills, medical debt, and depleted savings, along with other challenges that financial instability exacerbates.
Legislation in 2024 to raise the wage
Thirty states and the District of Columbia have a higher minimum wage than the national minimum. In 2024, Louisiana legislators have introduced four bills that would establish a state minimum wage and join these states in increasing the wage:
| Bill | Author | Bill Details | Tipped Wage Increase |
| House Bill 431 Senate Bill 173 | Rep. Delisha Boyd Sen. Gary Carter | Establishes a minimum wage of $10 an hour in 2025, $12 in 2027, $14 in 2029 | No |
| Senate Bill 180 | Sen. Regina Barrow | Constitutional amendment setting a minimum wage of $10.25 an hour by 2025 with annual increases tied to the rate of inflation for the prior 12 months | Limited; mandates that the tipped minimum wage must be at least half of the minimum wage, starting at $5.13 in 2025 |
| House Bill 290 | Rep. Denise Marcelle | Establishes a minimum wage of $10 in 2025, with an increase to $12 in 2026 | No |
House Bill 431 and Senate Bill 173 would establish a minimum wage of $10 an hour in 2025, rising gradually to $14 in 2029. The wage increases in these bills are not indexed to inflation, nor do they cover tipped workers. House Bill 290 would raise the minimum wage to $10 in 2025 and increase to $12 in 2026, but is not indexed to inflation and does not cover tipped workers. Senate Bill 180 would add language to the Louisiana constitution, setting a minimum wage of $10.25 an hour by 2025 with annual increases tied to the rate of inflation for the prior 12 months.
SB 180 is also the only one to raise the minimum wage for tipped workers, by requiring that the tipped minimum wage must be at least half of the minimum wage, starting at $5.13 in 2025. In a state where the leisure and hospitality industry is the 4th highest employer in the state, raising the tipped minimum wage is essential for all Louisianans to thrive. The tipped minimum wage has racist and sexist origins and today this low wage perpetuates economic inequality for women and people of color who make up the majority of the hospitality workforce.
Who benefits from raising the wage? Modeling the impacts of HB 431 / SB 173
Low-income, Black, and women workers would benefit disproportionally from a higher minimum wage. The Economic Policy Institute estimates that 1-in-6 Louisiana workers – 308,300 – would get a pay raise by 2029 if the minimum wage was set at $14 per hour, as HB 431/SB 173 would require. These workers would get an average annual raise of $3,000.

Low-income workers, workers of color, and retail and hospitality workers in the state would see some of the greatest gains:
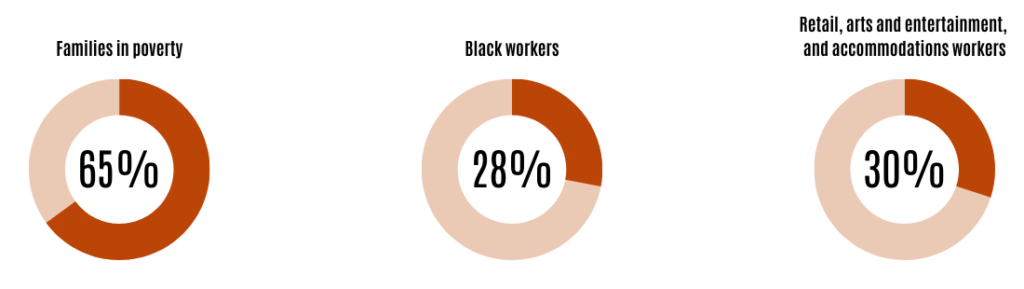
Almost two-thirds of families in poverty in Louisiana would benefit from increasing the minimum wage, while 28% of Black workers and 30% of Louisiana’s retail, arts and entertainment, and accommodations workers would all also see wage gains if these bills became law.
Many women in Louisiana would also gain from an increase in the minimum wage, with 22.9% of women workers across the state benefiting from the proposed law. Louisiana currently ranks 50th for gender pay equity, with women making 75 cents for every dollar made by a man. Raising the minimum wage could help narrow this wage gap and make Louisiana a better state for working women.
Who supports raising the minimum wage?
Voters across the country – and across the political spectrum – support raising the minimum wage, and have proven that consistently at the ballot box.
Over the last decade, voters in Arkansas and Florida have adopted ballot measures that have raised their states’ minimum wages (currently $11 and $12 per hour, respectively). In 2018, 68% of voters in Arkansas and 62% of voters in Missouri elected to raise the wage, demonstrating the popularity of the issue in conservative-leaning states. Louisiana law does not allow citizens to put referendums on the ballot, and state lawmakers have consistently rejected efforts to allow Louisianans to propose ballot initiatives.
Raising the minimum wage would strengthen Louisiana’s economy and workforce and reduce the state’s high poverty rate of 18.6%. It is also popular policy. A national 2024 CNBC|SurveyMonkey Small Business Survey found that 61% of the more than 3,000 businesses surveyed supported raising the minimum wage, anticipating potential increases in customer spending, tax revenue, and employee satisfaction. A 2019 statewide survey by LSU’s Manship School of Mass Communications found that 81% of Louisianans supported raising the wage.
Louisiana’s workers have been stuck too long at the federal minimum wage while the cost of living continues to increase. Low wages hurt our economy, slow our growth, and leave far too many struggling to meet their families’ needs. It is time to raise the wage and help all Louisianans thrive.
House bill 431 / senate bill 173
| Group | Wage-earning workforce | Count directly affected | Share directly affected | Count indirectly affected | Share indirectly affected | Total affected directly or indirectly | Share affected directly or indirectly | Total change in annual wagebill | Average change in annual wages (full time worker) | Average change in hourly wages |
|---|---|---|---|---|---|---|---|---|---|---|
| All workers | 1,803,000 | 186,900 | 10.40% | 121,400 | 6.70% | 308,300 | 17.10% | $617,889,000 | $2,142 | $1.39 |
| Gender | ||||||||||
| Men | 904,800 | 61,200 | 6.80% | 41,800 | 4.60% | 103,000 | 11.40% | $210,219,000 | $2,151 | $1.42 |
| Women | 898,200 | 125,700 | 14.00% | 79,600 | 8.90% | 205,300 | 22.90% | $407,670,000 | $2,137 | $1.37 |
| Teenager flag | ||||||||||
| Teenager | 56,000 | 35,800 | 64.00% | 6,800 | 12.20% | 42,700 | 76.20% | $113,489,000 | $2,993 | $2.51 |
| Age 20 or older | 1,747,000 | 151,100 | 8.60% | 114,600 | 6.60% | 265,700 | 15.20% | $504,400,000 | $2,013 | $1.22 |
| Age category | ||||||||||
| Age 16 to 24 | 235,600 | 98,700 | 41.90% | 34,500 | 14.60% | 133,200 | 56.50% | $313,042,000 | $2,613 | $1.88 |
| Age 25 to 39 | 646,700 | 53,700 | 8.30% | 44,700 | 6.90% | 98,400 | 15.20% | $196,804,000 | $2,096 | $1.16 |
| Age 40 to 54 | 539,300 | 18,600 | 3.40% | 22,500 | 4.20% | 41,100 | 7.60% | $58,103,000 | $1,464 | $0.84 |
| Age 55 or older | 381,400 | 16,000 | 4.20% | 19,700 | 5.20% | 35,700 | 9.40% | $49,941,000 | $1,421 | $0.94 |
| Race / ethnicity | ||||||||||
| White, non-Hispanic | 1,067,400 | 70,000 | 6.60% | 47,300 | 4.40% | 117,300 | 11.00% | $197,422,000 | $1,852 | $1.35 |
| Black, non-Hispanic | 552,500 | 94,700 | 17.10% | 61,500 | 11.10% | 156,200 | 28.30% | $350,675,000 | $2,341 | $1.42 |
| Hispanic, any race | 109,900 | 14,500 | 13.20% | 8,600 | 7.80% | 23,200 | 21.10% | $47,214,000 | $2,208 | $1.37 |
| Asian, non-Hispanic | 36,800 | 3,000 | 8.10% | 2,200 | 5.90% | 5,200 | 14.10% | $8,920,000 | $1,848 | $1.15 |
| Other race/ethnicity | 36,400 | 4,700 | 12.80% | 1,800 | 5.10% | 6,500 | 17.90% | $13,659,000 | $2,330 | $1.60 |
| Person of color | ||||||||||
| Not person of color | 1,067,400 | 70,000 | 6.60% | 47,300 | 4.40% | 117,300 | 11.00% | $197,422,000 | $1,852 | $1.35 |
| Person of color | 735,600 | 116,900 | 15.90% | 74,100 | 10.10% | 191,000 | 26.00% | $420,467,000 | $2,312 | $1.41 |
| Family status | ||||||||||
| Married parent | 416,400 | 11,700 | 2.80% | 14,500 | 3.50% | 26,200 | 6.30% | $41,687,000 | $1,648 | $0.93 |
| Single parent | 204,800 | 32,300 | 15.80% | 22,400 | 10.90% | 54,700 | 26.70% | $120,838,000 | $2,335 | $1.29 |
| Married, no children | 442,900 | 12,400 | 2.80% | 15,300 | 3.40% | 27,700 | 6.30% | $37,503,000 | $1,397 | $0.86 |
| Unmarried, no children | 738,900 | 130,500 | 17.70% | 69,300 | 9.40% | 199,800 | 27.00% | $417,862,000 | $2,263 | $1.55 |
| Usual weekly work hours category | ||||||||||
| Part time (<20 hours per week) | 80,900 | 24,300 | 30.00% | 8,100 | 10.10% | 32,400 | 40.10% | $39,497,000 | $1,308 | $2.03 |
| Mid time (20-34 hours) | 247,400 | 88,900 | 35.90% | 33,500 | 13.50% | 122,400 | 49.40% | $266,530,000 | $2,395 | $1.80 |
| Full time (35+ hours) | 1,474,700 | 73,800 | 5.00% | 79,800 | 5.40% | 153,600 | 10.40% | $311,862,000 | $2,121 | $0.95 |
| Educational attainment | ||||||||||
| Less than high school | 176,800 | 50,800 | 28.70% | 21,700 | 12.30% | 72,500 | 41.00% | $180,792,000 | $2,671 | $1.81 |
| High school | 566,000 | 69,800 | 12.30% | 52,900 | 9.30% | 122,700 | 21.70% | $246,293,000 | $2,111 | $1.27 |
| Some college, no degree | 442,000 | 59,600 | 13.50% | 36,700 | 8.30% | 96,300 | 21.80% | $170,580,000 | $1,945 | $1.33 |
| Associates degree | 129,600 | 4,200 | 3.20% | 5,500 | 4.30% | 9,700 | 7.50% | $14,101,000 | $1,489 | $0.92 |
| Bachelors degree or higher | 488,600 | 2,600 | 0.50% | 4,500 | 0.90% | 7,200 | 1.50% | $6,123,000 | $875 | $0.62 |
| Major Industry | ||||||||||
| Agriculture, fishing, forestry, mining | 64,200 | 3,100 | 4.90% | 2,200 | 3.40% | 5,300 | 8.30% | $15,209,000 | $2,862 | $1.32 |
| Construction | 136,500 | 2,800 | 2.10% | 4,800 | 3.50% | 7,600 | 5.60% | $10,659,000 | $1,397 | $0.76 |
| Manufacturing | 144,500 | 2,800 | 1.90% | 4,900 | 3.40% | 7,700 | 5.30% | $11,136,000 | $1,448 | $0.71 |
| Wholesale trade | 48,400 | 2,000 | 4.10% | 2,500 | 5.30% | 4,600 | 9.40% | $7,679,000 | $1,687 | $0.94 |
| Retail trade | 213,900 | 41,600 | 19.40% | 27,600 | 12.90% | 69,200 | 32.40% | $146,456,000 | $2,122 | $1.45 |
| Transportation, warehousing, utilities | 100,800 | 2,300 | 2.20% | 3,800 | 3.80% | 6,100 | 6.10% | $7,024,000 | $1,163 | $0.73 |
| Information | 27,800 | 1,000 | 3.60% | 1,000 | 3.60% | 2,000 | 7.30% | - | - | - |
| Finance, insurance, real estate | 88,900 | 2,100 | 2.30% | 2,300 | 2.60% | 4,400 | 4.90% | $6,304,000 | $1,438 | $0.93 |
| Professional, science, management services | 84,900 | 1,400 | 1.60% | 1,800 | 2.10% | 3,100 | 3.70% | $3,848,000 | $1,236 | $0.95 |
| Administrative, support, waste services | 55,700 | 6,400 | 11.50% | 6,300 | 11.40% | 12,800 | 22.90% | $23,311,000 | $1,828 | $1.09 |
| Educational services | 182,600 | 10,500 | 5.80% | 9,600 | 5.30% | 20,100 | 11.00% | $29,915,000 | $1,487 | $1.23 |
| Healthcare, social assistance | 276,900 | 28,900 | 10.40% | 22,900 | 8.30% | 51,800 | 18.70% | $110,416,000 | $2,133 | $1.21 |
| Arts, entertainment, recreational services | 41,400 | 8,100 | 19.60% | 4,400 | 10.70% | 12,500 | 30.30% | $25,755,000 | $2,297 | $1.55 |
| Accommodation | 23,100 | 6,700 | 28.80% | 2,500 | 10.90% | 9,200 | 39.60% | $25,536,000 | $2,892 | $1.70 |
| Restaurants | 135,500 | 56,200 | 41.50% | 14,500 | 10.70% | 70,700 | 52.20% | $149,869,000 | $2,833 | $1.97 |
| Other services | 70,500 | 9,200 | 13.10% | 6,600 | 9.30% | 15,800 | 22.40% | $34,232,000 | $2,179 | $1.37 |
| Public administration | 107,300 | 1,900 | 1.80% | 3,600 | 3.30% | 5,500 | 5.10% | $7,073,000 | $1,296 | $0.77 |
| Sector | ||||||||||
| For profit | 1,380,100 | 164,100 | 11.90% | 100,400 | 7.30% | 264,500 | 19.20% | $540,880,000 | $2,209 | $1.41 |
| Nonprofit | 125,500 | 8,800 | 7.00% | 6,600 | 5.20% | 15,400 | 12.20% | $29,468,000 | $1,934 | $1.38 |
| Government | 297,400 | 14,100 | 4.70% | 14,400 | 4.80% | 28,500 | 9.60% | $47,541,000 | $1,673 | $1.17 |
| Family income category | ||||||||||
| Less than $25,000 | 269,900 | 83,500 | 30.90% | 49,800 | 18.50% | 133,300 | 49.40% | $286,199,000 | $2,297 | $1.39 |
| $25,000 - $49,999 | 374,100 | 34,800 | 9.30% | 30,200 | 8.10% | 65,100 | 17.40% | $121,402,000 | $1,951 | $1.23 |
| $50,000 - $74,999 | 317,100 | 22,200 | 7.00% | 16,100 | 5.10% | 38,200 | 12.10% | $74,986,000 | $2,108 | $1.37 |
| $75,000 - $99,999 | 254,700 | 14,000 | 5.50% | 8,400 | 3.30% | 22,400 | 8.80% | $44,494,000 | $2,141 | $1.46 |
| $100,000 - $149,999 | 318,300 | 14,400 | 4.50% | 9,100 | 2.90% | 23,500 | 7.40% | $41,258,000 | $1,906 | $1.45 |
| $150,000 or more | 256,300 | 11,800 | 4.60% | 5,700 | 2.20% | 17,600 | 6.80% | $31,809,000 | $2,004 | $1.53 |
| NA | 12,700 | 6,200 | 49.10% | 2,000 | 15.90% | 8,200 | 65.00% | $17,741,000 | $2,261 | $2.02 |
| Tipped occupations | ||||||||||
| Not tipped | 1,754,500 | 167,100 | 9.50% | 121,400 | 6.90% | 288,500 | 16.40% | $617,889,000 | $2,142 | $1.39 |
| Tipped worker | 48,500 | 19,800 | 40.90% | - | - | 19,800 | 40.90% | - | - | - |
| Family income-to-poverty status | ||||||||||
| In Poverty | 165,500 | 76,400 | 46.20% | 30,700 | 18.50% | 107,100 | 64.70% | $259,006,000 | $2,613 | $1.67 |
| 100 - 199% poverty | 294,200 | 43,100 | 14.60% | 43,400 | 14.80% | 86,500 | 29.40% | $147,679,000 | $1,787 | $1.10 |
| 200-399% poverty | 565,900 | 39,300 | 6.90% | 31,000 | 5.50% | 70,300 | 12.40% | $130,873,000 | $1,980 | $1.29 |
| 400%+ poverty | 777,400 | 28,200 | 3.60% | 16,200 | 2.10% | 44,500 | 5.70% | $80,331,000 | $1,975 | $1.47 |